
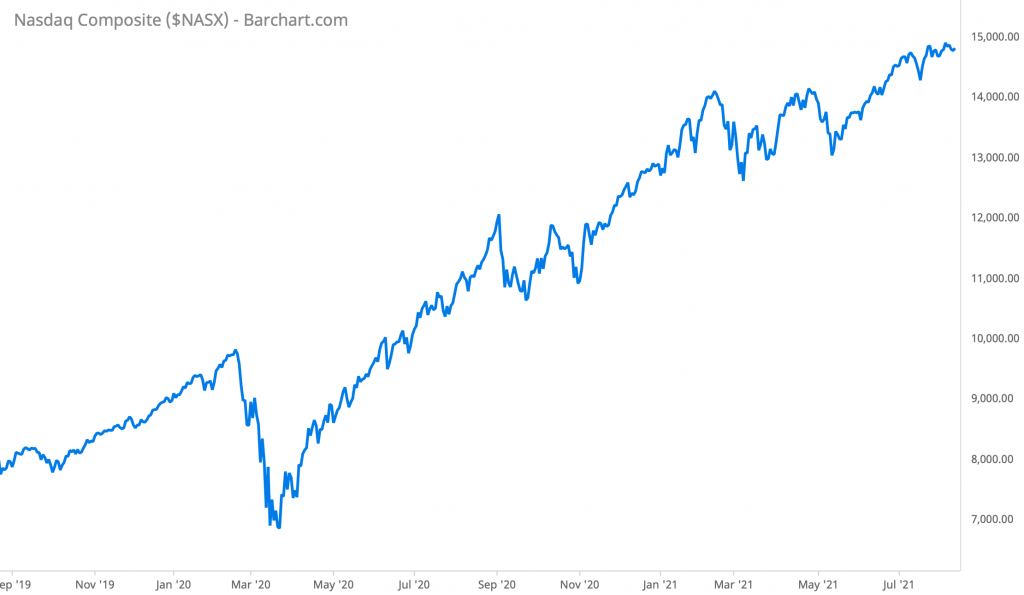
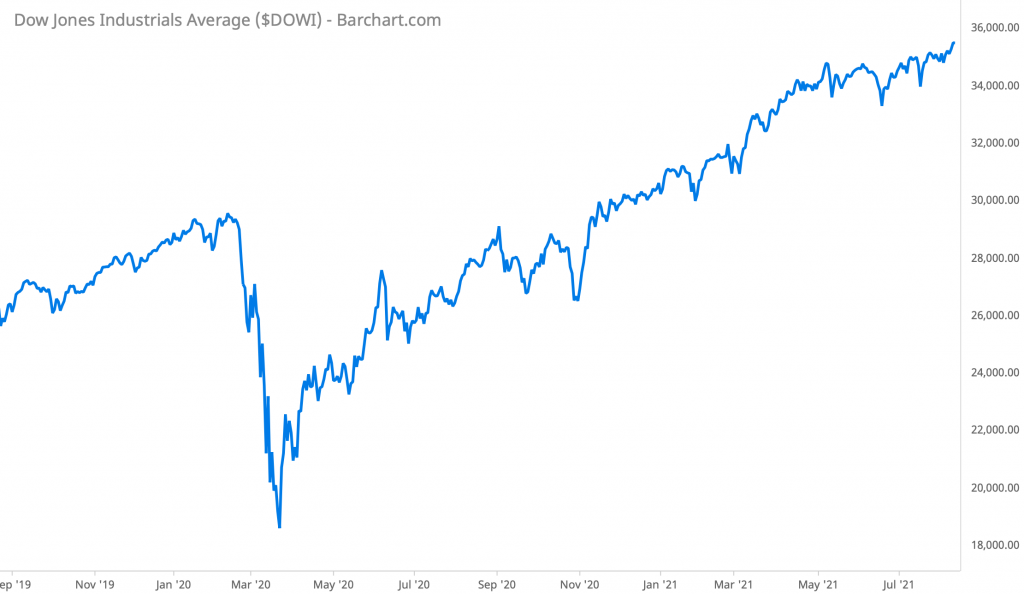
Interest in the stock market (especially from retail investors) has never been higher as equities continue to provide short-term traders and long-term owners outsized gains.
Many markets, including the NASDAQ and the Dow, are trading at record levels after the March 2020 COVID crash.
While traditional broad-based, large-cap index investing has led to significant returns for investors in 2021, a new breed of more active investors has arisen. These investors are looking to eschew traditional investments while also being able to “vote with their dollars,” in turn leading to the growth of investment into ESG and, of course, psychedelics.
Other market concerns, such as inflation, have also led many investors to look for companies that trade uncoupled from the traditional systems.
Psychedelic stocks fit both of these profiles, giving investors the ability to back companies and products that can both “do good” while also remaining less dependent on inflation, interest rates, or other economic factors.
The main concern for those investing in the psychedelics space is regulatory. Still, as we have seen with the progress in states such as Colorado, California, and Oregon (as well as following a similar playbook from the cannabis industry), investors can make a safe bet in the loosening of restrictions.
This has led to a growing psychedelic public market, with the overall market up nearly two-fold since the start of the year.
For context, at the start of the year, our Psychedelic Index consisted of only 34 constituents. Today that number is 59, representing a ~75% increase in the market size in less than 8 months.
Major exchanges, such as the NYSE, NASDAQ, and CSE, continue to bolster awareness and usher in millions of new investors in the space. Not only that, but we now have two (and soon to be three) ETFs with exposure to the psychedelics market.
In 2020, investors looking for exposure to the psychedelics market had to choose between a wide range of companies. In 2021, however, investors now have to ask themselves a new question: Should I just invest in a psychedelic ETF?
In this post, we attempt to compare how investors would fare investing in the current psychedelic ETFs with a selection of the largest psychedelic companies by market capitalization.
In turn, we hope to give existing and potential psychedelic stock investors the information needed to make the best decision for their own portfolio and risk profile.
Performance of the Largest Psychedelic Stocks
As we stated above, the current marketplace of psychedelic companies consists of 59 individual stocks. Although some large companies are trading with market capitalizations of more than $1 billion (3), most companies are trading for less than $25 million (23).
Therefore, to best represent what a true portfolio would look like for an individual investor, we have limited this study to companies trading with a market cap of $100 million or more.
The following table shows the year-to-date (YTD) returns of the 12 psychedelic stocks that fit the criteria. We will refer to these companies as the Top 12 Portfolio.
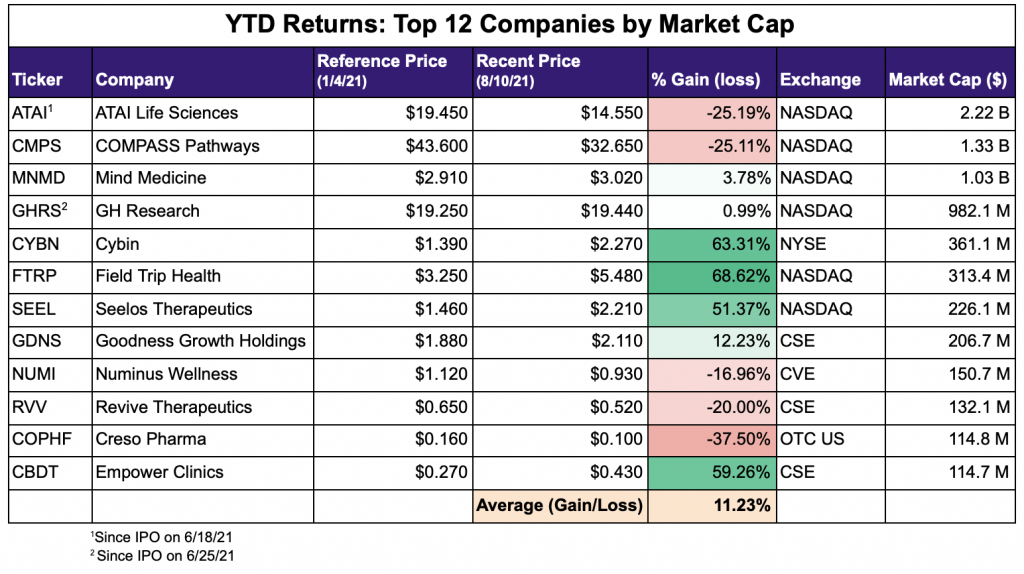
A diversified portfolio of psychedelic stocks with market caps greater than $100 million would result in an 11.23% return YTD.
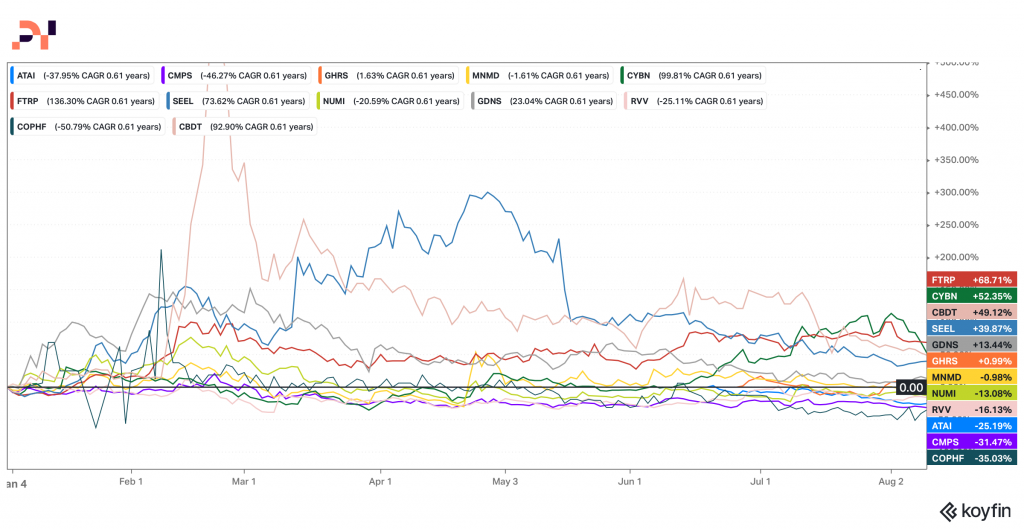
As you can see, the Top 12 Portfolio constituents were much more volatile in the first half of the year but have begun trading much more correlated since ATAI Life Sciences (ATAI), and GH Research (GHRS) went public in June.
Comparing the Data to Psychedelic Stock ETFs
The first thing investors need to realize when looking at psychedelic-focused ETFs is that they are not pure-play vehicles.
For example, the Defiance Next Gen Altered Experience ETF (PSY) comprises “35% psychedelics healthcare companies and 65% medical cannabis companies.”
And a glance at Horizons Psychedelic Stock Index ETF (PSYK), one will see names such as Johnson & Johnson (JNJ) and Abbvie (ABBV). Although to be fair, Horizons’ ETF has continued to grow much more concentrated on pure-play psychedelics companies as the market has matured.
Before we look at how the Top 12 Portfolio performed against the ETFs, let’s first take a look at YTD performance of the ETFs, respectively.
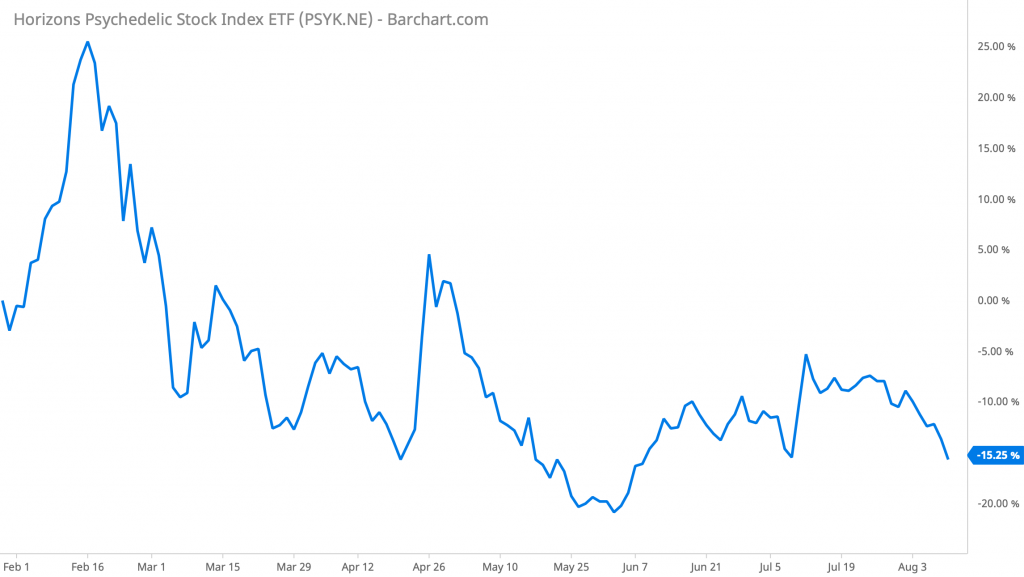
Horizons Psychedelic Stock Index ETF (PSYK)
As the first psychedelics-focused ETF to launch, Horizons Psychedelic Stock Index ETF (PSYK) created the first market for investors to get broad-based access to the psychedelics market through one vehicle.
Although an exciting development, investors have seen lackluster returns since the launch in January 2021. As of August 10, 2021, the ETF is down more than 15%.
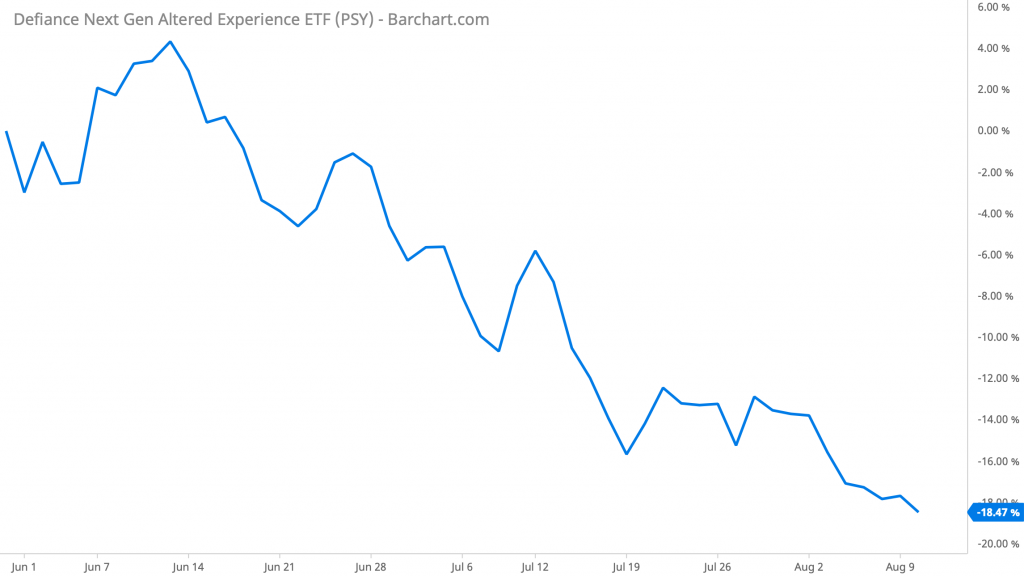
Defiance Next Gen Altered Experience ETF (PSY)
Although not the first psychedelics-focused ETF, Defiance’s Next Gen Altered Experience ETF still made a splash as the first US-listed ETF in the space.
Regardless of that fact, PSY has also led to disappointing returns for investors, dropping more than 18% in less than three months of existence.
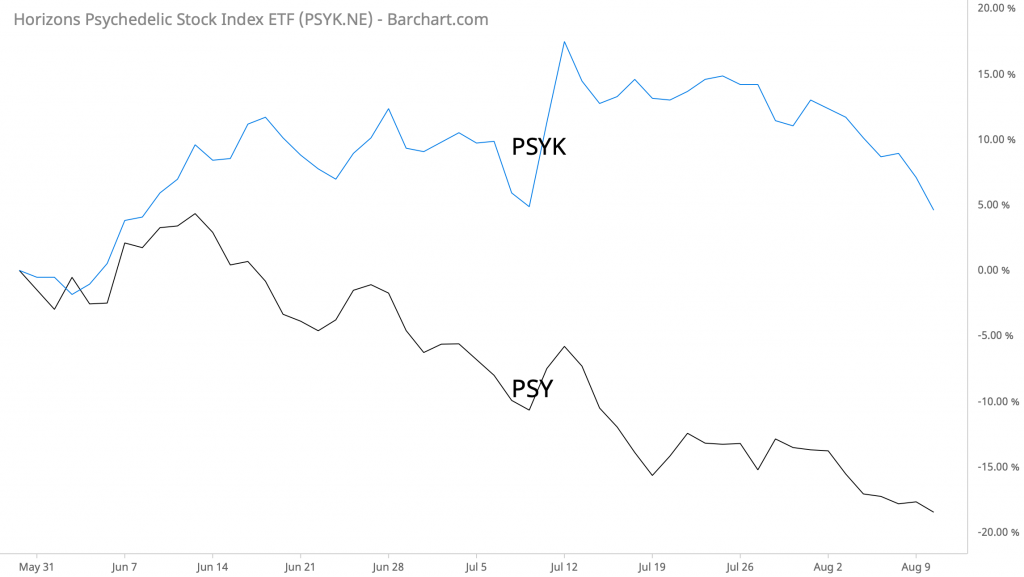
Comparing PSY and PSYK
Here we can visually see the performance of both PSY and PSYK since their respective launches.
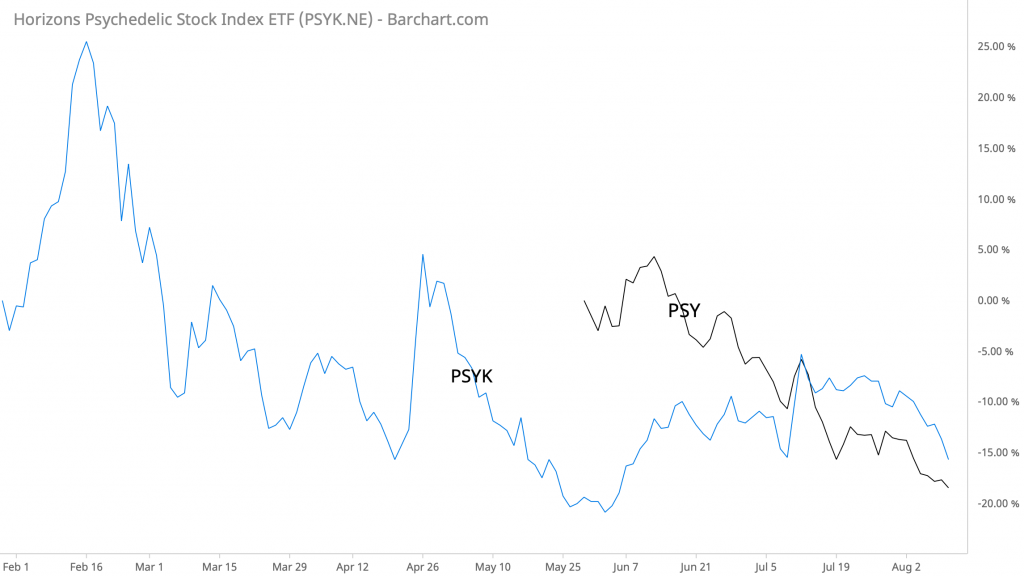
Interestingly though, since the launch of PSY in May, PSYK is up nearly 5% compared to PSY -18.47%.
Bringing It All Together
After looking at our performances of each ETF, we can now compare our benchmark Top 12 Portfolio to the ETFs. To get an accurate side-by-side comparison of price performance, we adjusted reference prices to the inception date of each ETF.
Top 12 Psychedelic Stock vs. PSYK
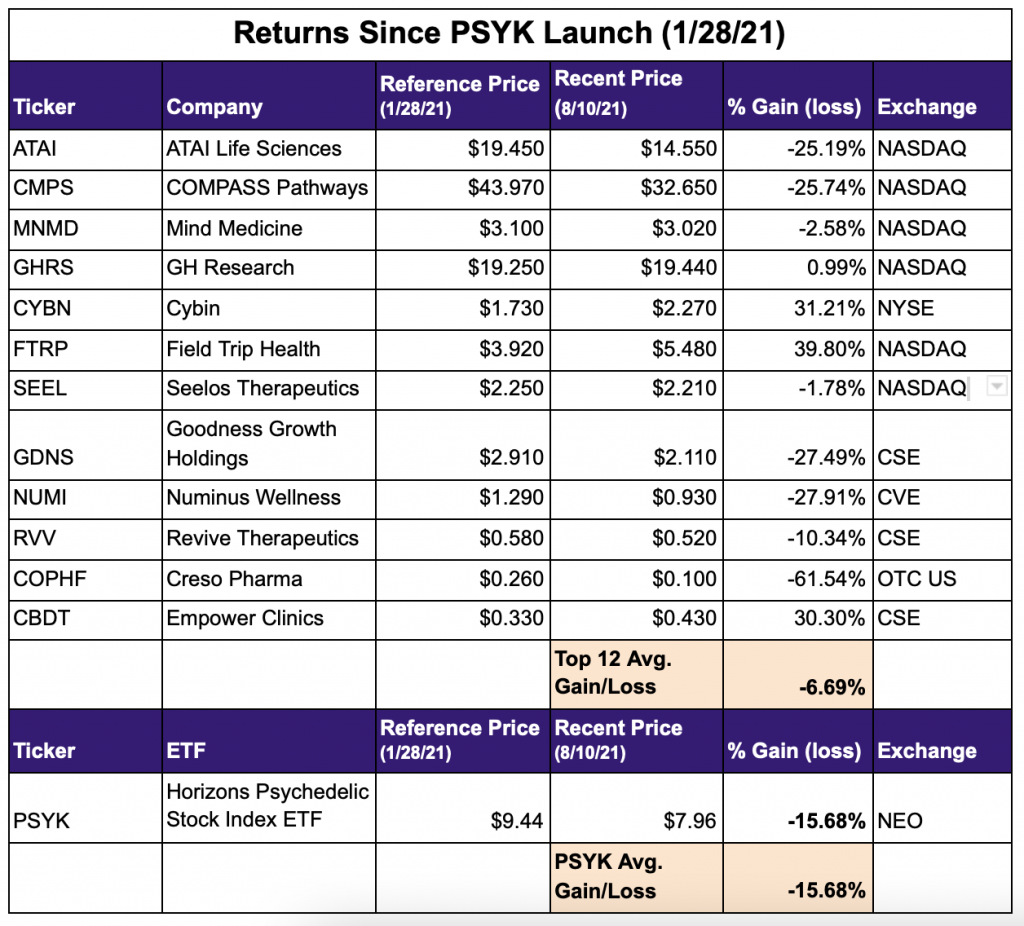
Since Horizons’ PSYK ETF launch on 1/28/21, the Top 12 Portfolio has limited losses for psychedelic-focused investors.
Top 12 Psychedelic Stocks vs. PSY
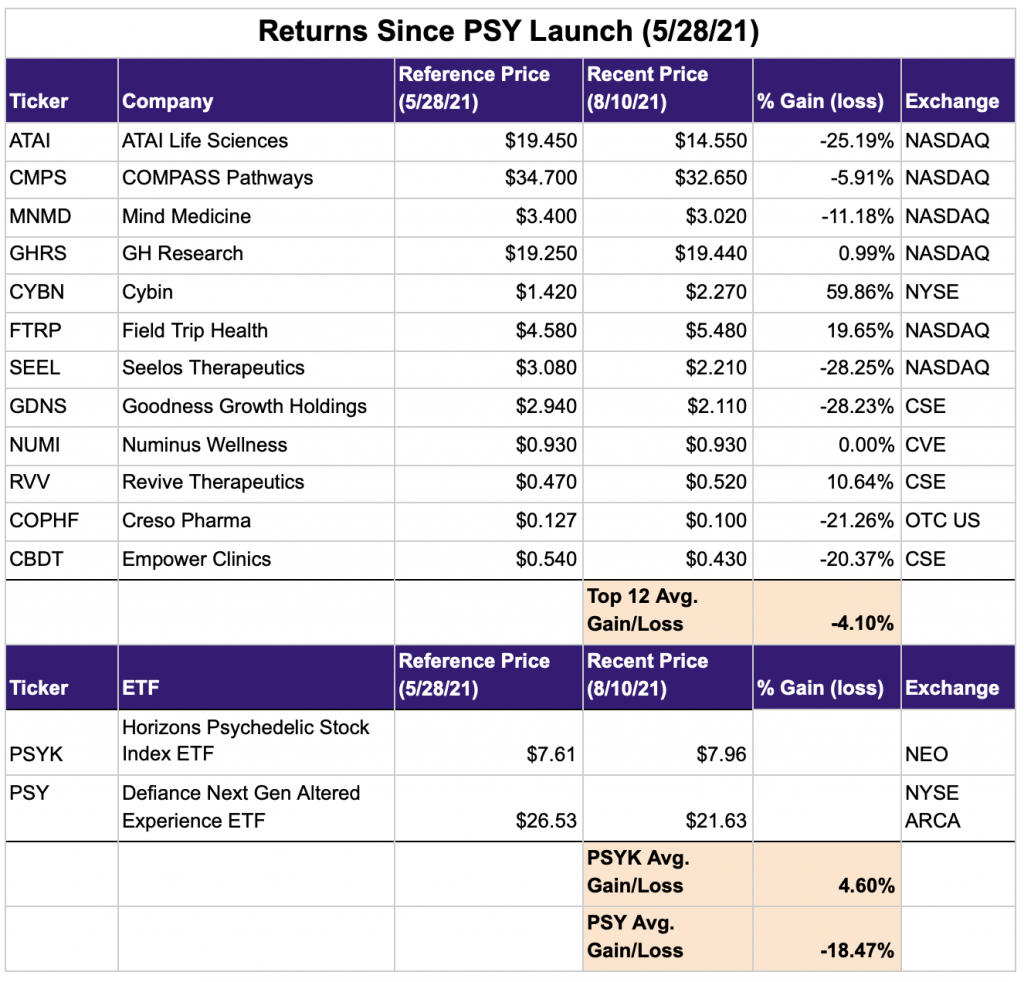
Since launching on 5/28/21, Defiance’s PSY ETF has fallen nearly 20%. However, during the same time frame, the Top 12 Portfolio has earned investors an average return of -4.10%. While these returns are significantly better than the performance of Defiance’s PSY ETF in this time (-18.47%), they don’t beat the performance of Horizon’s PSYK ETF (4.6%).
Top 12 Psychedelic Stocks vs. ETFs on a YTD Basis
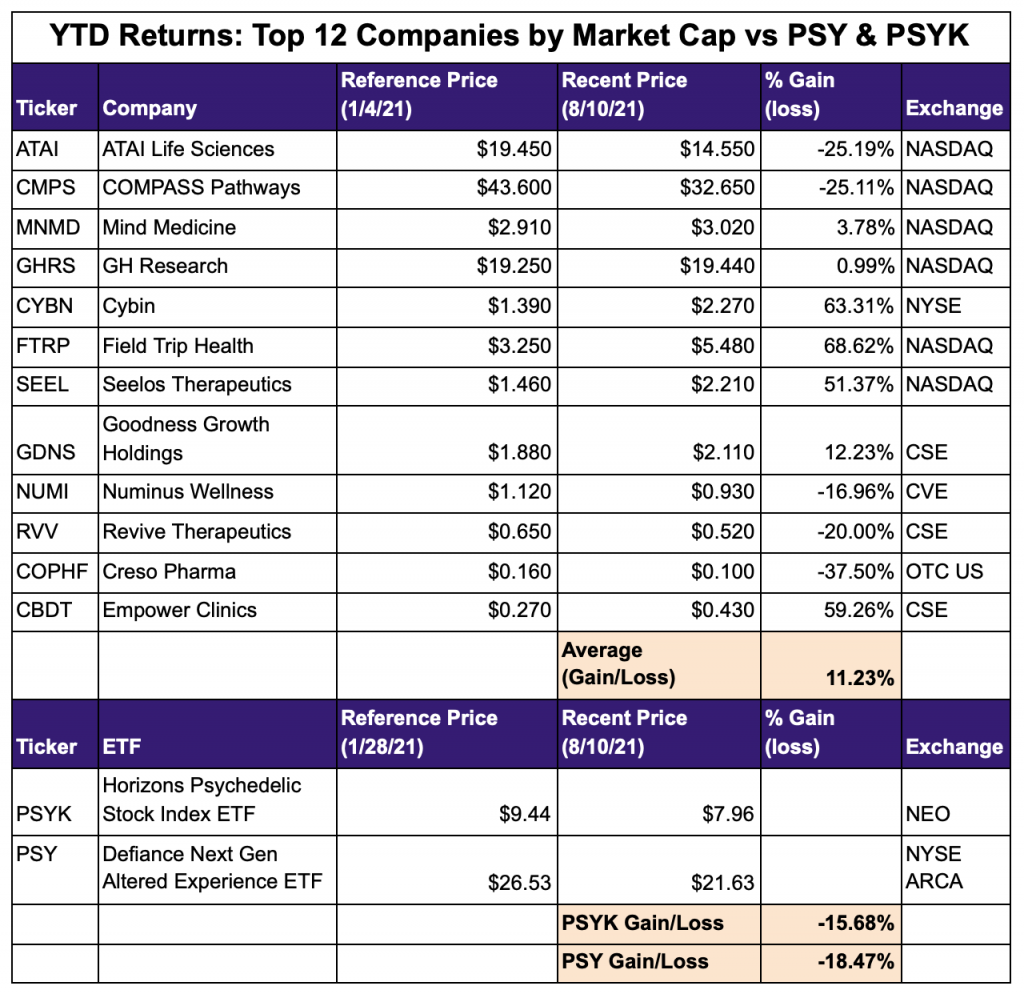
Now, perhaps most interestingly, let’s take a step back and look at returns on a year-to-date basis for the Top 12 Portfolio and the two ETFs.
In the below table, we can see that the Top 12 Portfolio significantly outperformed both ETFs, most likely because the ETFs launched after some huge runups such as the 130% run from Field Trip (FTRP) in January.
The team at Psychedelic Invest also decided to look at the performance of psychedelic stocks only trading on large exchanges (NYSE & NASDAQ).
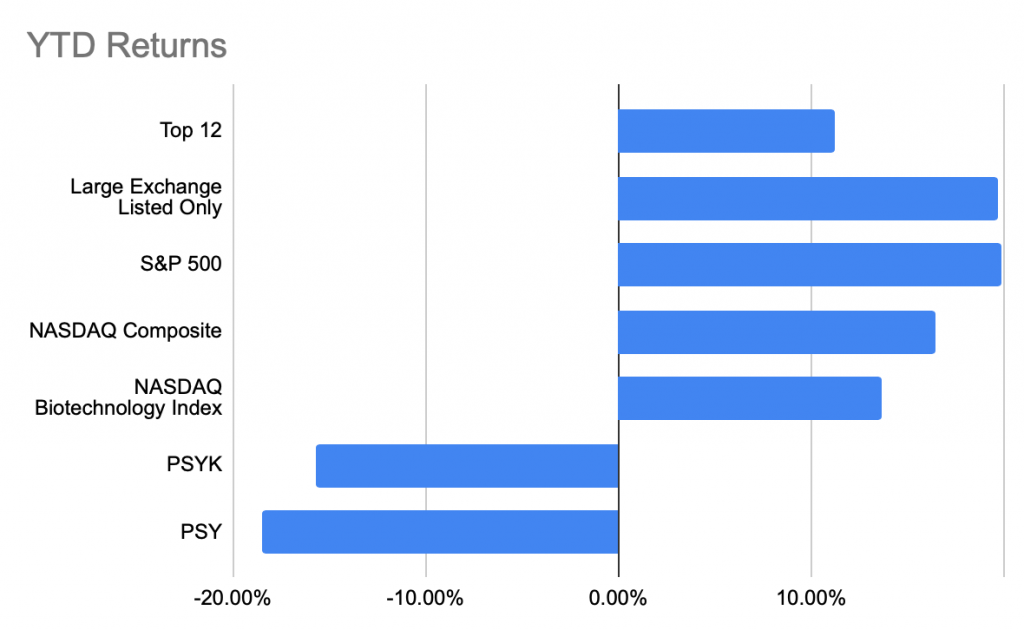
Had you only invested in those companies (ATAI, CMPS, MNMD, GHRS, CYBN, FTRP, SEEL), you would be sitting on average gains of 19.68% YTD vs. the 11.23% of the entire Top 12 Portfolio.
And digging even further, we can look at performance against traditional market benchmarks such as the S&P, NASDAQ, and the NASDAQ Biotechnology Index.
Key Findings
- Psychedelic ETFs have underperformed since their respective launches. Although psychedelic-focused ETFs are exciting from the perspective of a growing industry, so far, they have been suboptimal vehicles for investors looking to get exposure to the psychedelic market. This most likely results from their launch dates, holdings, and fees.
- An equally weighted portfolio of larger-cap psychedelic stocks has led to positive YTD returns but is still underperforming traditional markets. With 11.23% YTD gains, investing in psychedelic stocks has proven effective but still doesn’t beat the returns of the S&P 500, NASDAQ, and the NASDAQ Biotechnology Index.
- By limiting a psychedelic-focused portfolio to only (1) stocks with larger market caps and (2) stocks trading on large American exchanges, performance drastically increases. An equally weighted portfolio of the industries largest companies by market cap and only trading on the NASDAQ and NYSE, has led to average gains of 19.68% YTD vs.11.23% of the entire Top 12 Portfolio. 2021 has been the year of uplistings, and the stocks in this portfolio ride the hype to larger gains.